It’s not so much a goodbye. It’s more of a “see you less often.”
When we built the first version of SurveyOptic, text analysis wasn’t feasible at the speed and scale we needed. Word clouds came to the rescue as an efficient, even beautiful, way to show what people were talking about. Even if you’ve never heard the name, you’ll almost certainly recognise them: those clusters of words where the size of each word reflects how often it appears. The bigger the word, the more people mentioned it.
They were enormously popular in the earlier days of the internet, when sites like Flickr and Delicious used them as a more interesting alternative to plain text lists of topics. They gave a sense of which ideas were growing, which were fading, and what a community was collectively thinking about. For survey responses, they were a natural fit: an at-a-glance view of what hundreds of people had written, in their own words.
Art, science and psychology
Word clouds were never just functional. Tools like Wordle (the text visualisation, not to be confused with that game where you guess a hidden five-letter word), became something of a global phenomenon and turned the idea of words-as-visual-objects into an art form in its own right. Word clouds sit on the boundary between data science and art. Some people love them. Some people can’t stand them. Most people, if they’re honest, find them rather satisfying to look at even when they’re not entirely sure what they’re supposed to take away from them. That points to something interesting about their history.
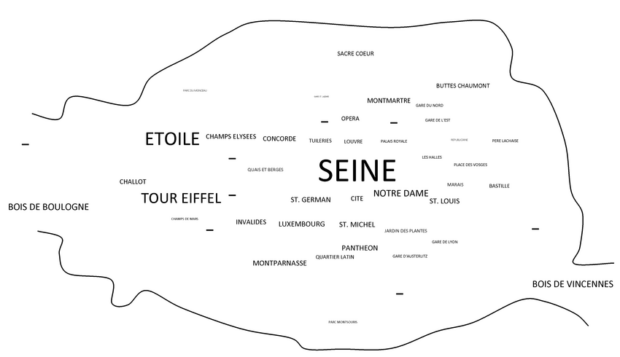
The idea of representing language visually, giving a shape and weight to what people say, predates modern computing by many decades. The concept is most often credited to Stanley Milgram, the American social psychologist best known for his deeply unsettling obedience experiments in the 1960s. Less well known is his work on what he called the “collective mental map of Paris” This was a study in which he asked Parisians to draw their city from memory, then overlaid those drawings to reveal which places appeared most often and most vividly in the shared imagination of its inhabitants. It was a word cloud!
When we started, SurveyOptic worked with surveys of a few dozen responses, occasionally a hundred or more. Fast forward to today and it’s not unusual for us to be working with tens of thousands of responses, and even hundreds of thousands. At that scale, word clouds will tell you what people are talking about, but they won’t tell you how they’re talking about it, or where in the organisation. Things have moved on considerably. SurveyOptic now includes sentiment analysis, keyword identification, topic and theme analysis. Perhaps counterintuitively, one of the most powerful visualisations for open-text questions at scale turns out to be the humble ordered bar chart. Sometimes the oldest tools are still the right tools.
As their purpose changes, we’ve been thinking about what word clouds might look like if we built them today. Browsers have come on a long way, and we can easily do things that were impossible back then. The result is a “snuggle cloud” – it is a little more artistic, a little more alive, and it’s now a chart option in SurveyOptic dashboards. Word clouds aren’t going anywhere. They’ll just be sharing the stage with some new stars.

Beyond LLMs.
We get asked frequently whether organisations can simply feed survey responses into ChatGPT, Copilot or a similar tool and let it do the analysis. It’s a reasonable question, and the answer is: not reliably, and not at scale. Even the most powerful large language models today don’t have the capacity to accurately analyse very large volumes of open-text survey responses. There are too many words, from too many different people. It is a task that falls outside what current models can handle, both because of the limits of their working memory (‘context window’ size is important here) and because of the way the models are trained and optimised.
For employee feedback, patient experience, public consultations, and other high impact surveys, you need analysis you can trust and audit, not outputs that are unrepeatable. Try typing “I think you have got that wrong” into the LLM after the analysis, you’ll get the idea. The purpose built text anlaysis tools we have created are significantly more accurate, private and secure than general-purpose LLMs. They also carry a considerably smaller environmental footprint than simply dropping an off-the shelf LLM in, and allow responses to be grouped into personas and clusters. We can help you understand what people are saying, without it costing the earth.
We have a number of new capabilities, including large-scale document understanding and inference from text comments, which deliver early detection of service issues from service user and employee feedback, and support for large-scale public consultations.
If you’re working with large volumes of text that need to be properly understood, we’d love to work together.