The Evolving Nature of Organisational Hierarchies: A Strategic Perspective
Every decision leaders make is shaped by the organisational structure. Yet most hierarchies are outdated maps, leading to costly missteps. The truth is that modern organisations don’t have one single hierarchy; they have multiple, evolving networks that demand new tools to navigate. Ignoring this complexity is to make decisions while blindfolded.
The Complexity of Hierarchies
Organisational hierarchies are often perceived as straightforward, linear structures. However, the reality is far more intricate. Organisations typically have multiple parallel hierarchies that serve different functions and purposes. As well as line-management structures, there are often structured communities of practice – virtual teams of ‘guilds’. None of these hierarchies are fixed; they change and evolve over time, reflecting the fluid nature of organisational dynamics. Recognising this complexity is essential for any leader who wants optimise their organisational strategies.
Hypergraphs: A Technological Superpower
Traditional approaches to hierarchies use “directed acyclic graphs” (or DAGs). “Directed” because there is an implied direction of flow, and “Acyclic” because there are no paths in the graph that loop back through the same point. Computationally, these are easy to represent and draw, but they aren’t a realistic representation, as often evidenced by the additions of dotted lines, side boxes and a range of other annotations that try to patch the gaps.
One of the most significant advancements in understanding organisational hierarchies is the use of hypergraphs. Hypergraphs can represent as many differerent conections as necessary, and allow teams and team members to exist in multiple groups simultaneously, reflecting modern team structures. This flexibility allows organisations to track the evolution of hierarchies over time and adapt to various contexts and purposes. Hypergraphs provide a robust framework for mapping complex organisational structures, making them a powerful tool for strategic planning.
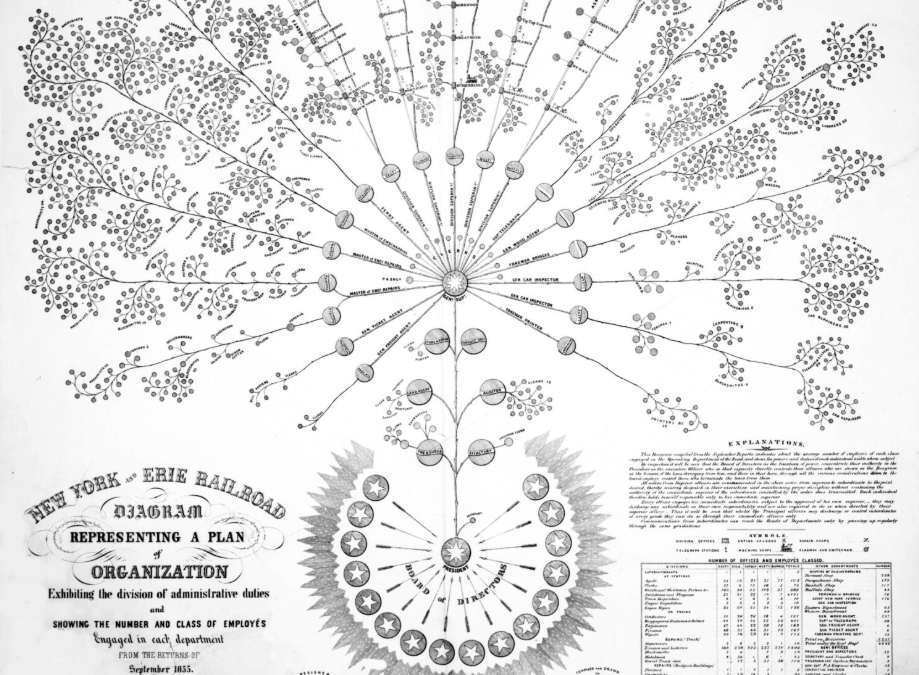
Even in 1895, the first organisational chart created by the Scottish-American railway engineer, Daniel McCallum, drawn by Canadian George Holt Henshaw, conveyed a more layer and fluid perspective. It doesn’t look like today’s organograms or even an organisational break down structure, but it is a more representative diagram of the railroad’s structure that any modern chart. While the Erie Ralroad Company was run on a strict, hierarchical, command-and-control basis, the diagram is incredibly organic, almost fluid.
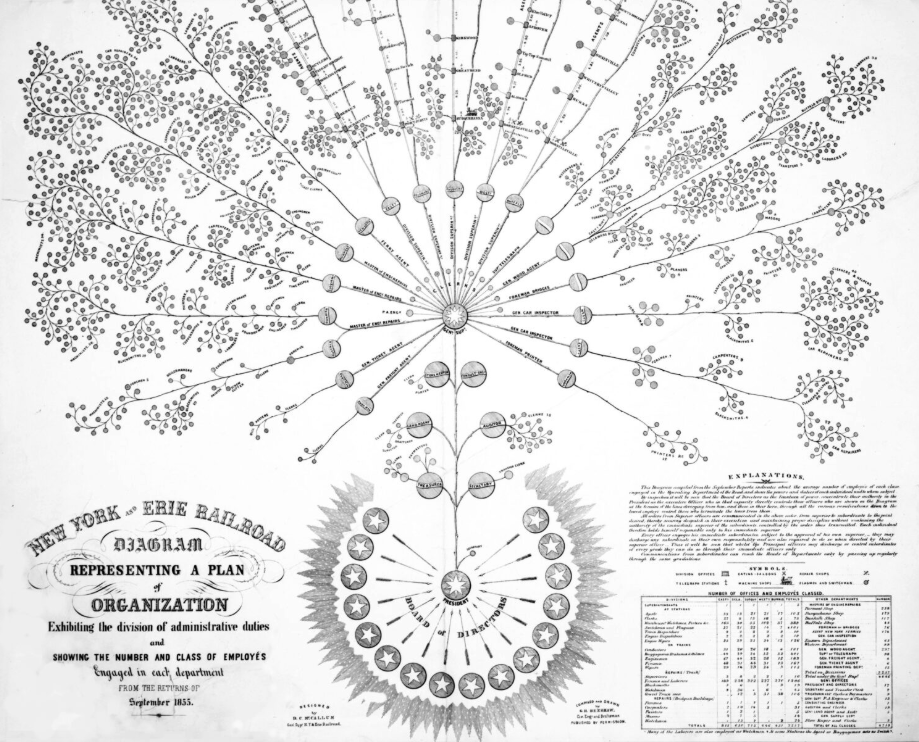
An exceprt, from the Library of Congress – https://www.loc.gov/item/2017586274/
Note how leadership was placed at the bottom of the diagram, as the root of the tree, surrounded by the governance of the board. It purpose was to document “this is how decisions are made and communicated.” By the time organograms moved into the digital domain, they had been inverted and become rigid, angular constructs. Traditional org charts force people into single boxes—like a static family tree. Hypergraphs act like 3D blueprints, letting individuals exist in multiple teams (e.g., a developer in Product group and a Cybersecurity Guild). This mirrors how work actually flows.
Long-time friend of SocialOptic, Kevan Hall wrote “Making the Matrix Work” back in 2013. To quote Kevan from the introduction to the book, “At its simplest, a matrix reflects the reality that work no longer fits within the traditional “vertical” structures of function and geography. Today, work is much more “horizontal”; it cuts across silos and even extends outside the organization to include suppliers, customers, and other business partners.” Over a decade later, most organisations haven’t really updated how they visually represent their structures. Tools like SurveyOptic use hypergraphs to eliminate the innacuracies and complexities that come from using techniques from a different era.
Context-Specific Hierarchies
Another critical aspect of managing hierarchies is the use of context-specific names and terms. Different parts of an organisation may refer to the same organisational unit in many different ways, depending on their function and perspective. When Sales says ‘HQ,’ they mean Finance. When HR says ‘HQ,’ they mean Legal. This misalignment causes miscommunication, delays and mistakes. Tagging units with context-aware labels (e.g., ‘Finance (Sales View)’) provides a context-specific approach to hierarchies that ensures that they are accurately mapped and understood, leading to better alignment.
The Role of Models in Organisational Mapping
Hierarchies are essentially models of the organisation. As the famous saying by British statistician George E. P. Box goes, “All models are wrong, but some are useful.” Hierarchy visualizations provide a simplified representation of complex structures, helping leaders to understand and communicate specific aspects of the organisation. While models may not capture every detail, they highlight essential elements that are crucial for strategic decision-making. If they are too simple, they lead to incorrect decisions, if they are too complex, they become less useful, because they aren’t operable. A perfect model that you can’t action is not useful. The art is to capture and represent the structures with the highest level of accurancy that you can. If the tools and techniques in use are hindering the process, then they need changing or improving.
Strategic Mapping and Wardley Maps
Mapping hierarchies is a vital exercise for strategic planning. It allows leaders to visualise the organisation from different perspectives and understand the needs of various stakeholders. From my perspective, there are strong parallels with Simon Wardley’s Wardley Maps, which are an excellent example of how mapping can be used to gain strategic insights (you can watch Simon giving an introduction here). By modelling the hierarchy of an organisation, leaders can identify key areas for impact and improvement, and align their strategies accordingly.
The Strategic Advantage of Hierarchical Understanding
Having a comprehensive understanding of organisational hierarchies provides a significant strategic advantage. It enables leaders to see the organisation from multiple angles and appreciate the diverse perspectives of its members. A purpose-specific tool for managing hierarchies ensures that the information is up-to-date and can highlight potential issues. This proactive approach helps in maintaining accuracy and addressing discrepancies before they become problematic.
Automation and Accuracy in Hierarchical Mapping
Technological tools for organisational mapping can automate tasks such as population counts and tracking changes over time. This automation enhances accuracy and efficiency, allowing leaders to focus on strategic planning rather than manual data management. By automating these processes, organisations can ensure that their hierarchical structures are consistently monitored and updated.
Beyond Hierarchy Tools: A Holistic Approach
While hierarchical mapping is essential, it is only one part of a larger system. Effective organisational management requires a holistic approach that triangulates problems and opportunities from various angles. Combining hierarchical mapping with other data sources provides a comprehensive understanding of the organisation. This integrated approach enables leaders to overlay experience data and make informed decisions that drive organisational success.
Understanding and navigating organisational hierarchies is a complex but essential task for today’s leaders. By leveraging technologies like hypergraphs, and adopting a context-specific approach, organisations can gain valuable insights to improve their decision making. The ability to map and understand hierarchies provides a powerful tool for navigating the complexities of organisational dynamics and achieving long-term success.