Online survey platforms have grown exponentially over the past 20 years or so, both in the number available in the market and the features and functionality of them. This growth has been fuelled by improvements to the development speed, processing speed and possibilities of technology itself. Before this technology existed, running a survey or interview process was time consuming and costly, and could be quite limited in the types of questions that could be asked. Due to the manual nature of the process, it took a long time to analyse some qualitative / open-ended / written answers, and these question types were often set aside in favour of quantitative data, or a hybrid like strongly agree-strongly disagree Likert scales.
As data processing became more powerful, it also became easier for companies to complete ‘standardised’ surveys. There has been an explosion in companies collecting data from standardised off-the-shelf surveys. Despite advancements in technology simplifying the analysis of verbose qualitative data, the allure of rapid quantitative analysis frequently prevailed. However, even as AI has developed and there are ever better and more reliable ways of quickly analysing qualitative data, there’s still a huge missed opportunity in using qualitative data. There is a lot of untapped value in qualitative data, particularly unstructured qualitative data like free text comment boxes which can help uncover what employees really think and feel. Let’s delve into the differences between these two types of data.
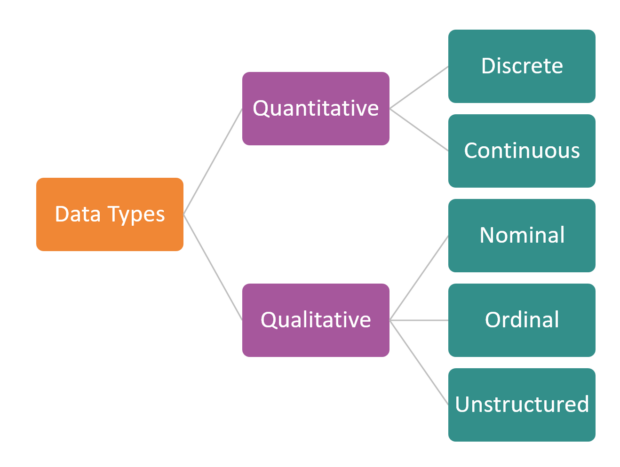
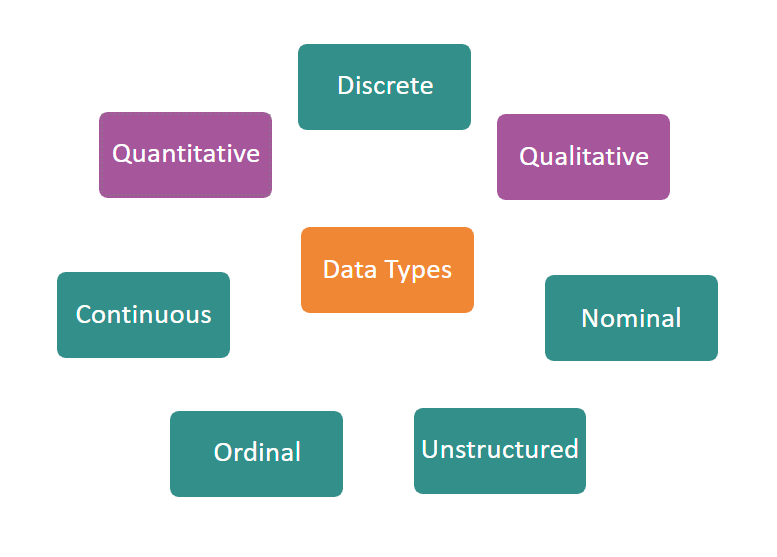
Quantitative vs. Qualitative Data – What’s the difference?
You may have heard of terms like quantitative and qualitative data before. On a simple level, a quantitative question will have a numerical answer, something that can be computed with numbers or quantities or measurement. It’s measuring how many things there are or how many events have happened. For example, the number of miles someone travels to a location, the number of times they eat in an on-site café each week and how many hours someone works per week. Quantitative data is also easily analysed with statistical calculations and is easily represented with data visualisations. Qualitative data on the other hand is non-numerical, typically computed with words describing the qualities or characteristics of something. It can become quasi-numerical data when analysed for themes or similar comments, and therefore summarised in a more visual way with counts for each ‘category’. Otherwise, it’s typically used in its original, wordy format to give context and descriptions ‘from the ground’.
Another lens for looking at the difference between quantitative and qualitative data is looking at subjectivity and objectivity. Quantitative data is measuring something, which for the most part means that 1) that information can be verified by having multiple measures taken by multiple people or on multiple occasions or 2) that information is objective or factual, given all the usual caveats around accuracy and potential errors. Conversely, qualitative data doesn’t attempt to measure anything, instead it aims to describe things. Quite often, on a personal level, meaning we’re gathering opinions or descriptions from each person. Those descriptions will be affected by a whole host of personal factors such as personality type, emotions, biases and personal values, and many more. It’s more often a subjective description based on an individual’s viewpoint. However, subjectivity and objectivity don’t line up exactly with qualitative and quantitative data respectively, as there are some qualitative data that can be objective fact, that can be verified by alternative methods, such as a person’s highest academic qualification.
Exploring Quantitative Data
There are two types of quantitative data – discrete and continuous.
A simple example of discrete data could be the number of sheep in a field. Discrete data is generally whole numbers, without the inclusion of decimal or percentage values. The numbers are finite, can often only be certain values, are separate from one another and can’t be divided. They typically look like counts or categories. With a more survey specific example, someone can either eat in the café or not eat in the café and therefore, the number of times they eat in the café per week has to be a whole number and is discrete data. A really simple example of continuous data would be someone’s height. Unlike discrete data, continuous data is not limited to set numbers, categories or intervals. It’s therefore common to see fractions or decimals in continuous data sets. In a survey context, you might be looking at how many miles someone travels to a location or the number of hours someone works per week.
Quantitative data usually provides measurements of things or events, which can be verified using alternative mechanisms, and so quantitative data is considered to be largely objective data. However, it’s worth mentioning that many of the usual suspects around errors can still be present. This can include errors like incorrect data entry, intentional misreporting for example due to social desirability, unintentional misreporting, and many more. This is why, where feasible, verifying quantitative data using alternative methods can be a really valuable tool for increasing survey validity and reliability.
Exploring Qualitative Data
When we think about qualitative data, there are typically two sub-types mentioned – nominal and ordinal. However, these don’t fully explain all of the answer types you might receive in a survey, and therefore, we’ve added unstructured (qualitative) data as a third sub-type to consider.
A simple example of nominal data would be eye colour. Nominal data is one of the simpler categories to explain. It captures all data where the categories/options have no relation or order to each other. There is also typically no numerical value to them, they’re purely descriptive, and it’s not possible to ‘rank’ one as higher or lower than another. In a survey, an example of nominal data might be country of origin or ethnicity.
An example of ordinal data would be highest educational level. Ordinal data presents various categories or options for respondents, but unlike nominal data, ordinal data does have an order to it. There is some logic that dictates order. However, there’s not necessarily a numerical value we can associate with that difference. For example, there is an order to qualification level, from no qualification to GCSE or A-Level qualification, to Bachelor’s then postgraduate degrees. However, there’s no quantifiable difference between a Bachelor’s and Master’s degree. We just know that one is higher than the other. With a more survey specific example, you may ask for someone’s job grade. Given the description of ordinal data, you might be wondering whether strongly disagree to strongly agree question types would be another example of ordinal data. They are ordinal data, but they’re a really special type of question, and therefore, they’re explained in more detail in the next section!
Both nominal and ordinal data will provide you with counts against each ‘label’, enabling some statistical analyses and numerical visualisation of the results. That’s why these qualitative data methods are more widely used than unstructured qualitative data.
Finally, we have unstructured qualitative data. These are all of the comments, notes and other content given in open text question types. They are unstructured because there are no set categories or options for people to pick. They can write whatever they like, worded however they want to.
How does quantitative and qualitative data fit together?
There’s one thing we haven’t yet covered and that’s Likert scales such as 5 point strongly agree to strongly disagree scales. In a way, it’s a hybrid between quantitative and qualitative data. Likerts were created to bridge the gap between qualitative and quantitative data, enabling otherwise qualitative data (opinions) to be gathered in a more structured, quantitative way. This also enables us to statistically analyse qualitative / subjective data – something which cannot be done on strictly qualitative data. It’s discrete because there are set categories, and it’s ordinal, with the difference between strongly agree and strongly disagree assumed to be linear, on a continuum from one end to the other. However, whilst we can say that one end of the scale is more positive than the other, we don’t quantify or put any value to the difference. So for example, strongly agree is more positive than agree, but we don’t know how much more positive, and we don’t assume it’s the same distance between each option, like neutral to agree and agree to strongly agree. Likert questions enable respondents to show the intensity of their opinion using a simplified set of categories. It’s not perfect, but is a valuable tool in a survey designer’s toolkit.
Often, questions or types of data don’t fit naturally within the quantitative or qualitative bucket, or within the sub-types under each, and may fit under two apparently conflicting sub-types at once. It’s also possible to change the type of data between buckets and sub-types, if helpful for analysis. One way you may do this is by asking employees how many hours they work per week, with a free text numerical entry question type [continuous quantitative data], but then coding those answers into 2 or 3 categories, for example full-time (being anyone over 35 hours) or part-time (being anyone under 35 hours)[discrete quantitative data]. There are many reasons why you might do this, including bundling up smaller response numbers or purely simplicity. There are even statistical analyses you can perform to determine whether the different responses you receive are sufficiently similar that they can be grouped in the way you intend, essentially allowing the patterns in response data to guide the categories you create.
Integrating Quantitative and Qualitative
For most surveys, our customers are trying to gather information and opinions from their stakeholders (employees, customers, suppliers) in relation to certain topics. At one end of the spectrum, they could ask completely open-ended questions and allow stakeholders to write their answers in their own words, giving our customer more qualitative data. At the other end of the spectrum, customers could use categories and options to ask stakeholders which option best fits their opinion on the topic, giving them more quantitative data. Think about the difference between the questions, ‘How connected do you feel to your team on a personal level’, with a text box to answer vs. ‘I feel connected to my team on a personal level’, with 5 options from strongly disagree to strongly agree. Inherently, both quantitative and qualitative data possess distinct advantages and limitations. They will also fit more naturally with some types of questions or surveys than others, and it’s worth understanding what they are. We’ll dive into some of those merits and drawbacks here, but like most things in life, rather than picking just one approach, it’s often better to find the right way to combine approaches, enabling you to reap the benefits whilst reducing the drawbacks.
Benefits of Quantitative Data
Quantitative data is best suited to gathering views en masse, helping you evaluate what people’s opinions or likely actions are. Respondents are asked to provide a number of something, or in the case of Likerts, best match their opinion to the provided options. This gives you a quick and easy way to summarise the opinions of a large group of people into something succinct such as an average opinion or sentiment.
Another advantage of quantitative data is that it can be verified using other methods. When asking someone how many times they do something, it’s possible to verify that in an alternative way such as analysing access card logs, or cross checking with others. Given the range of statistical analyses open to quantitative analysts, there are also additional ways to verify the validity of the data and to exclude outlying answers, so that the data you keep is accurate.
Quantitative questions are also much quicker and easier for participants, making them popular with survey designers and respondents alike, due to the reduced time to complete and likely gains in response rate. The more responses there are, the more likely the survey is to provide a representative sample. So there are huge benefits to this.
The aim of quantitative data is in some ways to limit the number of answer choices, in order to analyse the data more easily and draw conclusions that can be generalised across the group.
The biggest challenge with quantitative data is that it doesn’t tell you why, which limits its use, and it is particularly susceptible to the analyst’s own opinion shaping the results and interpretation. Quantitative data also often comes with a trade-off between accuracy and specificity of an answer, and the easy summary of answers. So for example, asking employees to rate from strongly disagree to strongly agree, whether they believe their workplace to be an inclusive one. Whilst it makes the answers easier to analyse, it loses some of the nuance of whether people do believe their workplace to be inclusive, and likely, some stories about how the workplace is or isn’t inclusive. The easiest way to overcome this challenge is with the inclusion of qualitative questions and data.
Benefits of Qualitative Data
Qualitative data helps you to understand the meaning, context or why behind other answers. Not only does it explain the why, but it does it in the respondent’s own words. It’s their language. So as well as providing the why, you can also learn even more from the words they choose, the intensity of their comments, the length or brevity of their statements. It gives you a very personal understanding of something from that individual’s own viewpoint, including their innermost thoughts or feelings that often wouldn’t otherwise see the light of day.
As there are no pre-suggested answers, like there are when categories are provided, respondents can tell you about anything. So for example, if you wanted to ask about the most valuable employee benefits you offer, you might provide employees with a list and ask them to select their favourite, or you might ask them to free-type their favourite. By allowing them to name anything they consider to be a valuable benefit, you might receive answers you wouldn’t have included in the original list, and/or you may get subtle differences in the responses that you wouldn’t have seen otherwise. Perhaps employees really value later starts in the morning, which wouldn’t have been obvious had you given them the option of ‘flexible working hours’.
One really valuable way of using this ‘anything is possible’ concept is by doing a 2 step survey process. In the first step, using more qualitative questions, really open, exploring the landscape, suggestions and opinions. Really enabling people to tell you anything. Then, in the second step, using more quantitative questions to evaluate the options and opinions discovered in the first step.
The aim of qualitative data is to gather the raw, uncategorised comments of respondents, to fill in the gaps about why and how they may act or think in a certain way.
The biggest challenge with qualitative data is the limited range of statistical analyses available to analysts. It is really hard to objectively summarise and explain qualitative data in a numerical way. It’s relatively impossible to compare and standardise answers to provide a complete picture of what’s happening. As analysts, quantitative data is the typical way that we try to understand the severity or impact of data in order to evaluate the potential risk(s) and/or make decisions with it. How many people said the same thing? How are responses distributed across all participants? That’s how we decide how much we need to worry about a certain question’s results. We therefore need to remember that qualitative data is not there to provide conclusions on ‘what’ or ‘how many’. It is there to fill in the gaps and help teams explain the ‘why’ and this is a really big mindset shift, preventing lots of organisations embracing qualitative data. Not only that, but qualitative data is subject to a number of statistical biases and limitations and therefore has somewhat of a perceived credibility issue. For example, if you had a survey of 2000 employees’ responses, for the most part you’d probably have 2000 answers to quantitative questions. They might not be perfect, but you have a large set of data to work with. However, for any qualitative free text questions, you’re unlikely to receive anywhere close to 2000 responses for various reasons, and therefore, it’s hard to know how the comments you do have reflect the thoughts of the broader population. Are they the comments of only the most ardent supporters/dissenters, willing to spend the additional time sharing their more personal feelings, over simply clicking an agree/disagree box? Or do they reflect the mixed opinions of all staff?
Our Favourite Qualitative Questions
This blog post is designed to encourage survey designers to embrace the qualitative questions, to use them more and to be open to the breadth they bring. So whilst we’ve given you the facts on both quantitative and qualitative question types, for this section, we’re focussing on qualitative questions only, in the hopes we can inspire you to include them in your design.
Remember, qualitative questions are designed to fill the gaps between quantitative questions simply asking respondents to select the option which best fits their opinion or provide a numerical answer. Qualitative questions are there to provide context and give insights into why people chose the categories/options they chose. Therefore, firstly, they need to be paired with good quality quantitative questions which explain the what and how many. Secondly, qualitative questions need to be crafted really carefully to ensure they focus on gathering comments and opinions, without trying to muddy that with quantifying those insights.
Here are some example questions you may find helpful when designing your survey(s):
- [For people who answered they had not used a particular service/benefit e.g. salary sacrifice scheme] Tell us about the reason(s) why you haven’t yet used this service…
- Which benefit or perk would you most like us to introduce at ABC?
- [To probe the answer to the preceding question] You said you [e.g. strongly agree] that XYZ. Can you tell us more about why you feel that way?
- What 3 words would you use to describe the team you work in?
- [To hypothesis test potential changes] Would you be more or less likely to use X/Y/Z service/benefit if we [option A]?
- [To gather suggestions for changes] What change(s) would make you more likely to use X/Y/Z service/benefit?
- [To identify the motivations of your employees] Why do you come to work?
- What could we change to improve your experience of working for ABC?
- How did your onboarding experience compare with your expectations for onboarding?
In Conclusion
Analyzing qualitative data has become remarkably efficient, so survey designers should adopt and integrate it into their work more frequently. The comments may be unstructured to start with, but with the help of technology, it’s possible to turn a list of diverse opinions and comments into a structured list of quantified themes. A well designed qualitative question, alongside a suite of quantitative questions can help you answer the ‘what’ and the ‘why’, enabling you to understand what needs to change, along with which levers to pull and which levers to keep untouched.
If you’re interested in learning more about survey design in general, this post explores some of the considerations you might make when designing an employee engagement survey. We also have a post exploring how you design the rollout of a survey from things like whether a survey is repeated, feeding back to respondents and ensuring action is taken on the results.
The team have supported a variety of public and private sector customers to deliver all manner of surveys and forms through the SurveyOptic platform. If you’re wondering, ‘is it possible?’, the answer is probably, ‘yes’. You can reach out to the team anytime – we’d be happy to show you what’s possible.
You might also be interested to read our blog posts: Measuring Employee Engagement and Surveys Feedback and The Big Yak