
by Benjamin Ellis | Mar 6, 2018 | Privacy, Project Management
It isn’t here yet, but the UK’s Data Protection Bill moved a step closed to becoming the Data Protection Act 2018, as it received a second reading in The House of Commons yesterday. The Bill introduces the UK’s derogations (or variations) for GDPR,...

by Benjamin Ellis | Apr 20, 2012 | Knowledge Work, Leadership, Management, Milestone Planner, Project Management
Look at pretty much any job specification for a project manager and you will see (in the UK at least) a requirement that candidates are PRINCE2 certified. For those not familiar with it, PRINCE2 is a UK government endorsed, project management methodology. It stands...
by Benjamin Ellis | Aug 12, 2011 | Milestone Planner, Project Management
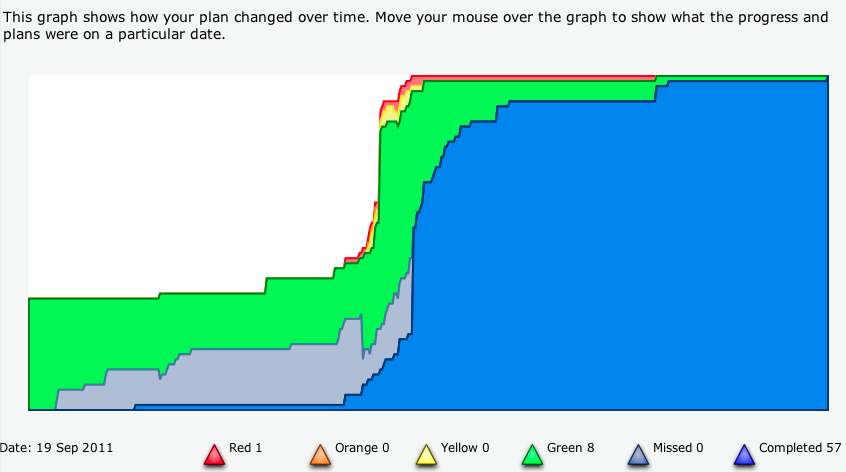
Burn-down graphs (or charts) are most often associated with the Scrum methodology increasingly favoured by many software developers (you can get to grips with it in this 10 minute video). They help you to visualise how you are progressing through your work...
by Benjamin Ellis | Aug 9, 2011 | Leadership, Management, Milestone Planner, planning, Project Management
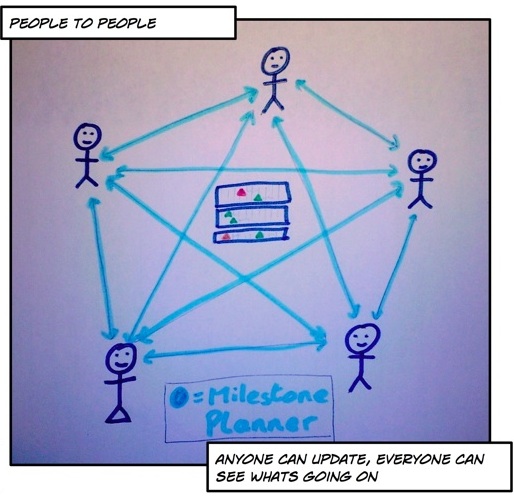
You’ve made plans, got people on board and kicked off your project.. but as the focus turns to delivery, how do you keep the momentum going? We’ve found that much of the trick of successful project management is helping people to make clear commitments,...
by Benjamin Ellis | Feb 2, 2011 | Milestone Planner, planning, Project Management
I’ve come across two very different approaches to making plans over the years (OK it’s more than two, but I’m trying to keep it straightforward)… The first approach is where someone locks themselves in a darkened room with some ‘gantt...

by Benjamin Ellis | May 4, 2010 | Milestone Planner, planning, Project Management
Before you read this you’ll need a pen and a piece of paper… OK. Draw a square. Now draw a triangle on top of the square. On the right hand side of the triangle, just on top, draw a rectangle. Now inside the first square you drew draw four other squares...